Where to Now?
Submitted by Wespac Advisors, LLC on January 21st, 2016- Now that the S&P 500 has dropped nearly -14% from its all-time highs and reached support from the 2014 lows , the question is where to now?
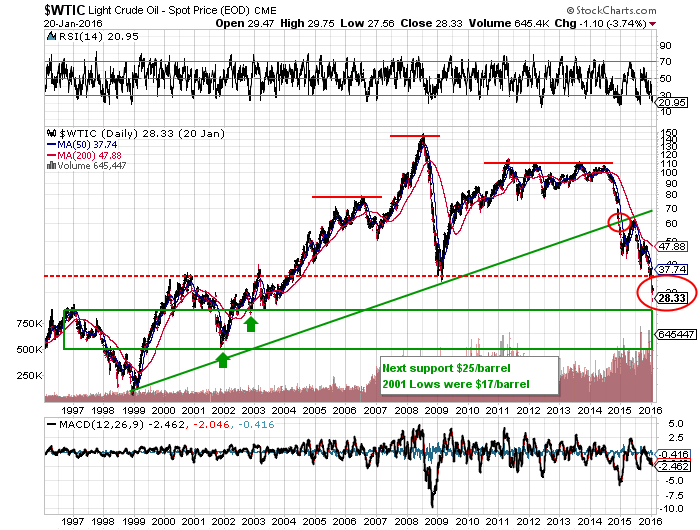
- US equity markets have been largely running in lockstep with crude oil prices; crude oil is now trading below the 2009 lows and appears headed for support from the 2002-2003 lows in the $17-25/barrel range.
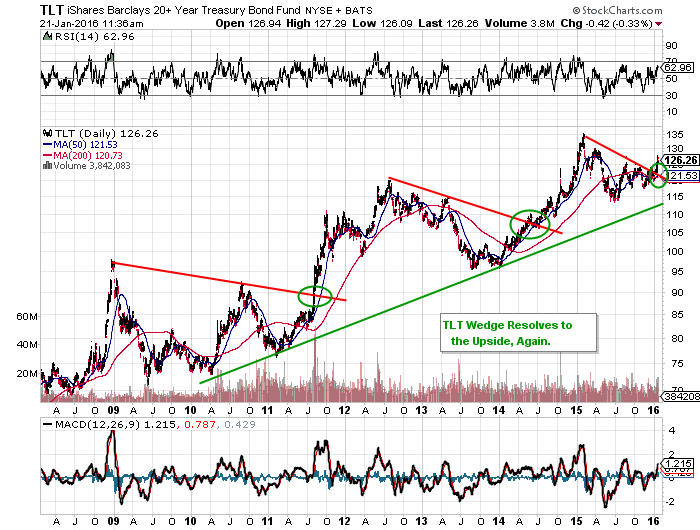
- Long duration Treasury Bonds have, for the third time since the 2008 Crisis, resolved a wedge formation to the upside; the last two times this pattern emerged, bonds had a multi-month surge to new highs.
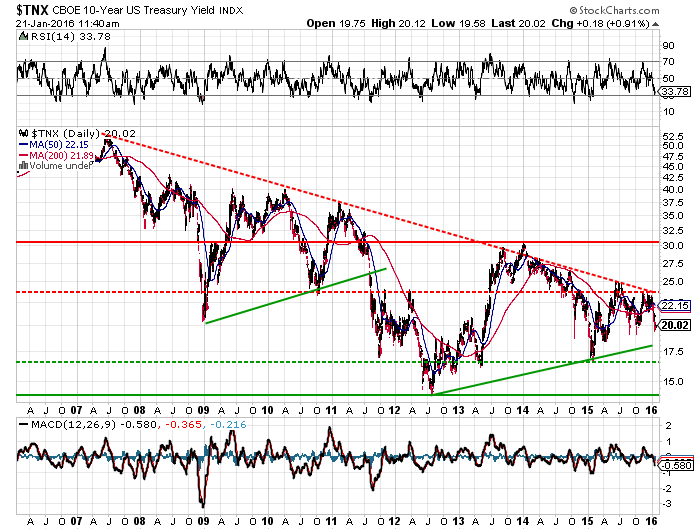
- 10-Year Treasury rates have a similar pattern and have just failed at their downtrend line dating back to 2006; rates have already fallen to 2.0% and likely to fall at a minimum to 1.8% if prior patterns continue.
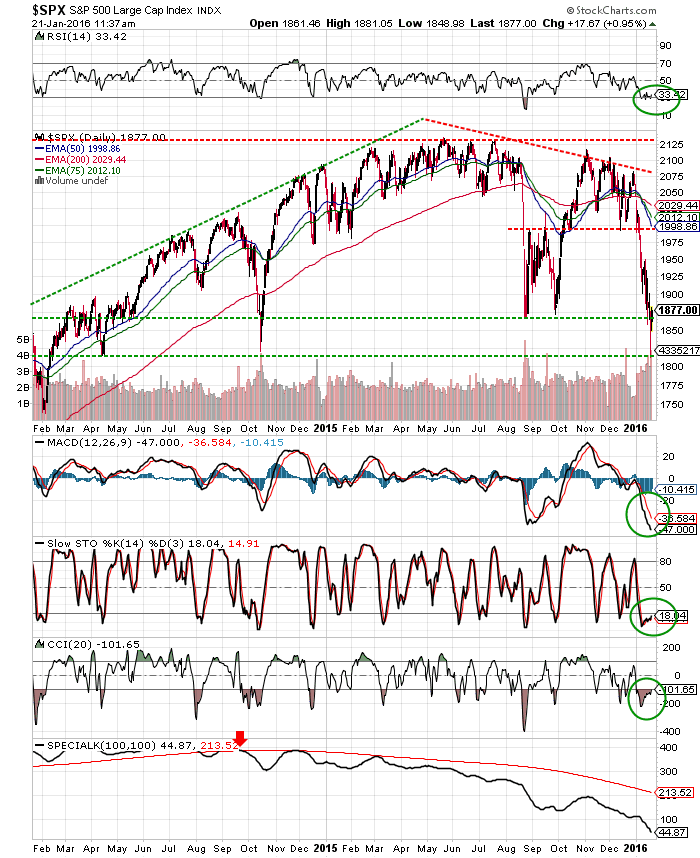
- The S&P 500 corrected below its August 2015 lows reaching lows we have not seen since April 2014 and October 2014; the S&P 500 is clearly oversold and is due for a bounce.
- This bounce appears to be underway right now, with the S&P 500 ricocheting from the 1815 level to 1883 since yesterday; this rally has to push through resistance in the 1880-1905 area and the 10-day and 20-day EMA to be more than just a one-day wonder.
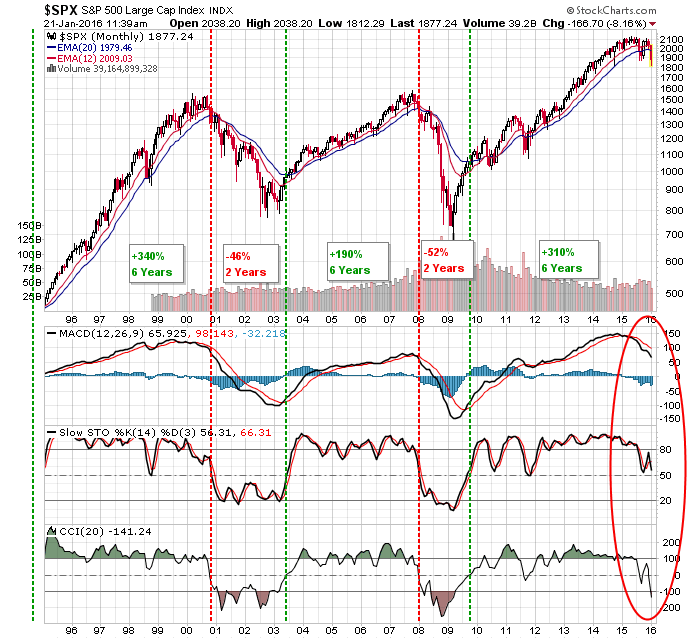
- A very negative chart development has occurred with this correction, with the S&P 500 now trading well below its 12-month EMA (2009) and 20-month EMA (1979); a bearish cross of these two EMAs has been a very good indication of the start of a bear market cycle since 1995.
- If the S&P 500 cannot sustain a bounce back above the 1980 levels, we will be soon faced with the question of whether this 20-year bull/bear indicator has called the start of a bear market.
- There will be substantial economic and earnings announcements over the coming weeks and bullish expectations are in trouble; perhaps the most bearish is the Atlanta Fed’s GDPNow which is calling for just a +0.7% GDP growth in 4Q16.
- It is entirely possible that the weaker than forecast economic and earnings data has already been anticipated by the markets; however, it seems likely that volatility will stay elevated into February.
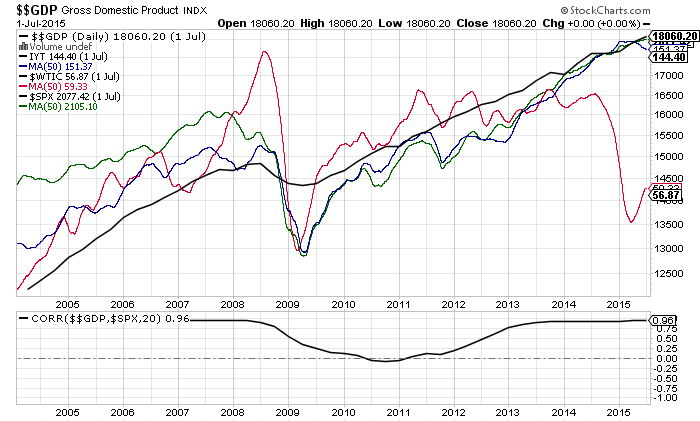
- As a final note, we are in uncharted waters now with crude oil dropping below 2009 levels; GDP, crude oil, the transports, and the S&P 500 have long traveled with high correlation. If the fall in crude does not find support and begin to rally, it will certainly raise the question of whether GDP and the S&P 500 will catch down to oil.
- Read more to see the charts supporting these comments.
US equity markets have been largely running in lockstep with crude oil prices; crude oil is now trading below the 2009 lows and appears headed for support in the 2002-2003 lows in the $17-25/barrel range.
Long duration Treasury Bonds have, for the third time since the 2008 Crisis, resolved a wedge formation to the upside; the last two times this pattern emerged, bonds had a multi-month surge to new highs.
10-Year Treasury rates have a similar pattern and have just failed at their downtrend line dating back to 2006; rates have already fallen to 2.0% and likely to fall at a minimum to 1.8% if prior patterns continue.
The S&P 500 corrected below its August 2015 lows reaching lows we have not seen since April 2014 and October 2014; the S&P 500 is clearly oversold and is due for a bounce. This bounce is underway right now, which the S&P 500 ricocheting from the 1815 level to 1883 since yesterday; this rally has to push through resistance in the 1880-1905 area and the 10-day and 20-day EMA to be more than just a one-day wonder.
A very negative chart development has occurred with this correction, with the S&P 500 now trading well below its 12-month EMA (2009) and 20-month EMA (1979); a bearish cross of these two EMAs has been a very good indication of the start of a bear market cycle since 1995. If the S&P 500 cannot sustain a bounce back above the 1980 levels, we will be soon faced with the question of whether this 20-year bull/bear indicator has called the start of a bear market.
There will be substantial economic and earnings announcements over the coming weeks and bullish expectations are in trouble; perhaps the most bearish is the Atlanta Fed’s GDPNow which is calling for just a +0.7% GDP growth in 4Q16. It is entirely possible that the weaker than forecast economic and earnings data has already been anticipated by the markets; however, it seems likely that volatility will stay elevated into February.
As a final note, we are in uncharted waters now with crude oil dropping below 2009 levels; GDP, crude oil, the transports, and the S&P 500 have long traveled with high correlation. If the fall in crude does not find support and begin to rally, it will certainly raise the question of whether GDP and the S&P 500 will catch down to oil.