Sideways
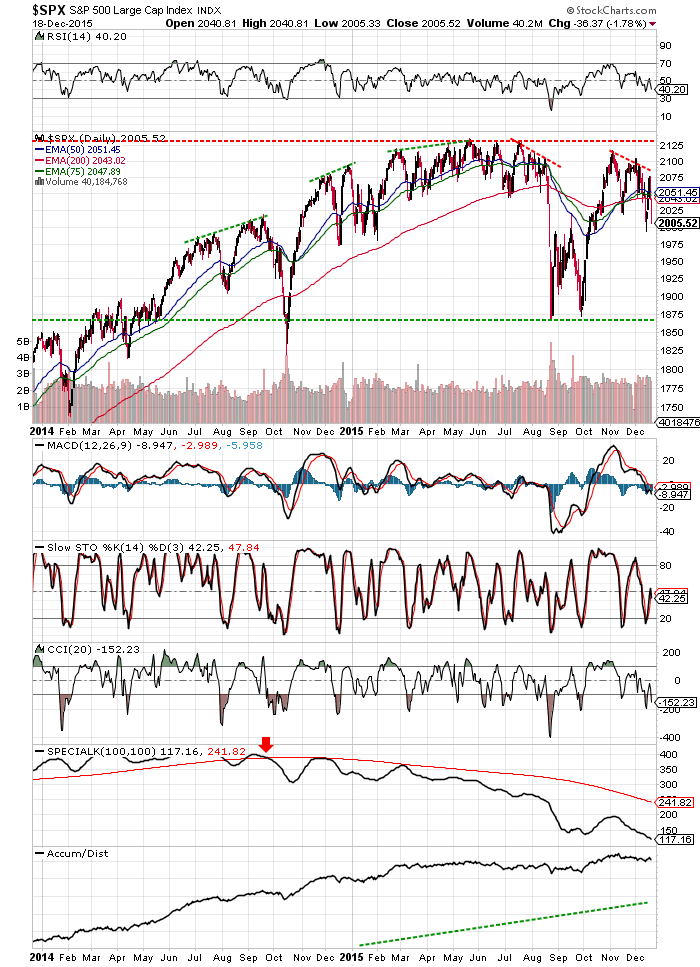
Submitted by Wespac Advisors, LLC on December 18th, 2015- The S&P 500 has been trading in a wide 250 point range since May 2014
- Up until June 2015, the trend was clearly up as we saw a progression of higher highs and a 200-day EMA with a consistent positive slope
- The summer volatility in the index has turn the 200-day EMA slope negative, and, despite a run near the all-time highs in October, the 200-day EMA has not been able to reach its August highs.
- We have now in the middle of the second sequence of lower highs, which suggests that the character of the market is changing.
- There is increasing significance to the bottom of the trading range; the 12-month bearish cross below the 20-month EMA has been a fairly consistent indicator of the start of a bear market, and the 20-month EMA is now nearly aligned with the bottom of the range.
- While the dominant pattern is sideways, there is increasing risk that we revisit the bottom of the range; if the bottom of the range does not hold on a prolonged basis, it would be a very bearish signal.