Reversal in 7-Year Buyback Leadership
Submitted by Wespac Advisors, LLC on February 3rd, 2016- Over the past seven years, there has been growing leadership by stocks whose companies were the most aggressive in reducing share counts by buying back their own stock.
- This became such a prevalent strategy that Standard and Poors started computing the effective tailwind to earnings per share from stock buybacks.
- According to Standard and Poors, in 4Q15, 77.6% of the S&P 500 reduced their share counts year-over-year and 26.8% reduced their shares by 4% or more. 22.4% had higher share counts year-over-year, and just 5.5% increased their shares by more than 4%. Standard and Poors forecasts that, on average, the share buybacks last quarter added “at least a 4% tailwind to current EPS”.
- The buyback trend was not lost on the creators of ETFs — Powershares created PKW, the PowerShares BuyBack Achievers ETF to track companies with aggressive buyback programs. PKW is comprised of companies “that have effected a net reduction in shares outstanding of 5% or more in the trailing 12 months.”
- PKW currently holds 24.0% Consumer Discretionary, 22.1% Industrial, 17.9% Financials, 13.3% Information Technology, and 9.2% Health Care companies. The top 20 holdings currently are McDonalds, Boeing, AIG, Mondelez, Lowes, Qualcomm, Biogen, Express Scripts, Monsanto, Delta Airlines, Northrop Grumman, Travelers, Illinois Tool Works, Valero, Twenty-First Century Fox, Emerson Electric, HCA, Intuit, Aflac, and Deere.
- Beginning in 2011, PKW started consistently outperforming the S&P 500; from September 2011 through its peak in March 20, 2015, PKW gained 212%. From September 2011 through its peak in May 21, 2015, the S&P 500 gained 188%.
- PKW is now trading down 16.9% from its peak, while the S&P 500 is trading down 10.2% from its peak.
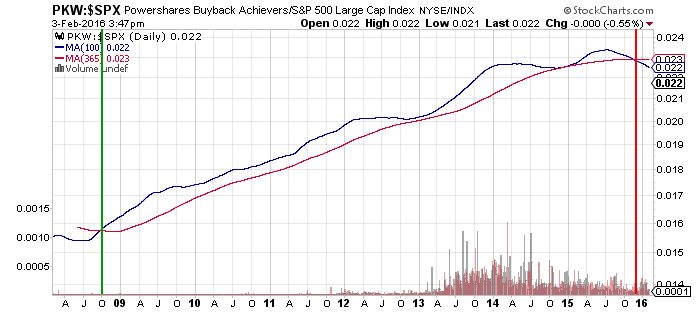
- The relative strength of PKW versus the S&P 500, on a long-term basis, has now reversed in favor of the S&P 500.
- Along with news of various companies restricting or canceling buyback programs, this technical observation may well be signaling an end of this market phenomenon.
- Read more to see the long-term relative strength chart of PKW versus the S&P 500.