Price Action : Then and Now
Submitted by Wespac Advisors, LLC on February 19th, 2016The failure of earnings to reverse course to the upside after peaking in 3Q14 puts the equity markets at fundamental risk.
The rolling corrections starting in the summer of 2015 have set up a trading pattern that has some analogies to the patterns seen in late 2007 and early 2008.
The point of this post is NOT to forecast that the markets will trade to the 2007-2008 patterns; the point is to identify the price-action conditions that existed in 2007-2008 before the crash and to compare them to conditions now.
50-day EMA versus 200-day EMA bearish cross: This occurred at the end of 2007 and remained in a bearish condition through the 2008 crash. This bearish signal was triggered in September 2015, reversed in November 2015, and triggered again in January 2016. In order for this signal to be reversed, the S&P 500 would have to have a sustained rally above the 200-day EMA which is currently in the 2004 level, or +4.7% higher from current levels.
Creation of a double neckline: In early 2008, the market appeared to double bottom and immediately rallied back above the 50-day and 200-day. That rally failed and the correction that followed found support at the mid-2006 lows from 2 years before. In a much more rapid progression today, the S&P 500 doubled a bottom in the August-September 2015 period and immediately rallied back above the 50-day and 200-day. This rally also failed, as it did back in mid-2008, and proceeded to drop to a support level from 2 years ago (April 2014 and October 2014).
Failure of the double neckline: The second lower neckline failed in September 2008, unleashing the crash of 2008. This has not yet occurred in 2016; it would take a sustained move under the 1810-1820 level for the current pattern to match the 2008 pattern.
Major negative systemic catalyst: The failure of Lehman Brothers was a huge catalyst in September 2008, which prompted violent downside volatility. It is unknown if there are any similar catalysts that could emerge in the near term. There is attention being paid to the situation with Deutsche Bank, that may be structurally at risk and whose stock is tracing out a similar pattern as Lehman, now down -69% from its January 2014 high and -51% from its August 2015 high.
It is always important to remember that the future cannot be found in the rearview mirror. Having said that, it is also important to understand history.
It is always possible that the market will find a footing here and a strong rally could reverse many of these negative technical conditions. A sustained move above the 200-day EMA would be a positive indicator that the current price action has diverged from the 2007-2008 patterns.
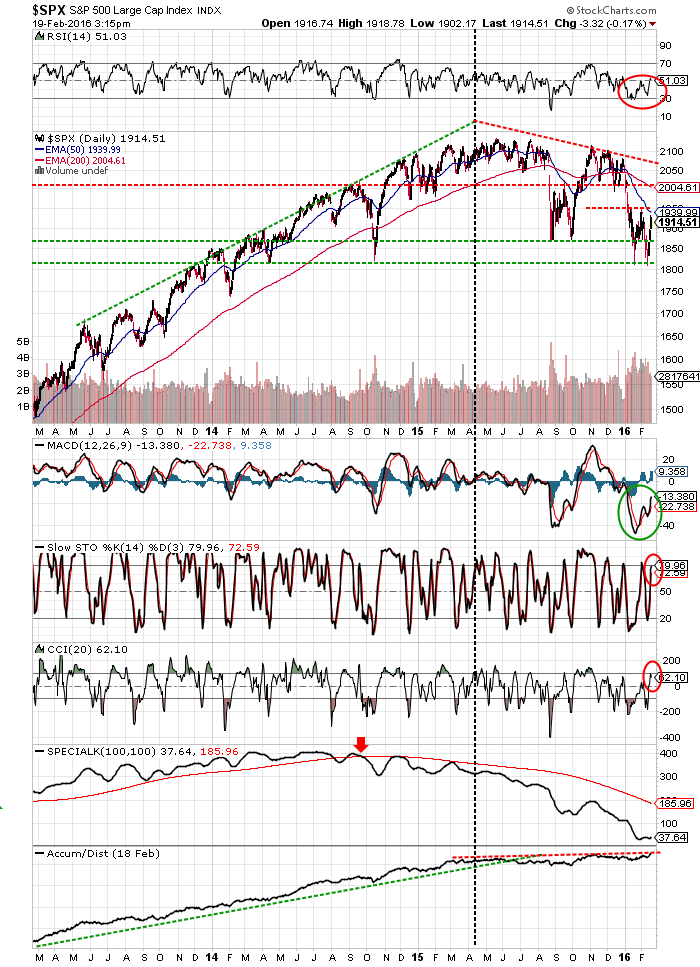
Read more below to see the charts supporting these points.
The S&P 500 price action leading up to a market top and the 2008 crash:
The current price action of the S&P 500: