
Market Review & Outlook: July 2018
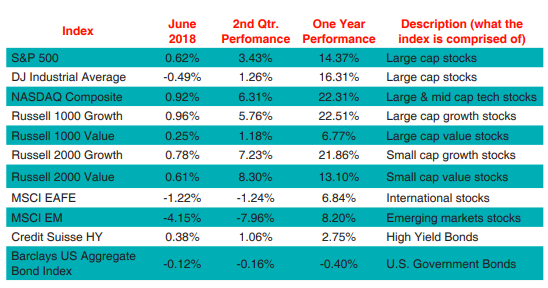
Submitted by Wespac Advisors, LLC on October 16th, 2018With the aging bull market now in its tenth year, investors are looking for signs that stocks can continue to enjoy gains in a market where shares have looked historically expensive for several years now. As is usually the case, the markets are giving us conflicting signals about its direction, but for now the primary trend still looks higher. While there are some minor cracks in the case for a positive move to new all-time highs, there are signs that stocks in the US have convalesced through the corrective phase that began back in early February. For a closer look at how various stock and bond asset classes performed in recent periods, please refer to the table below.
Unfortunately, headline news seems to be driving much of the recent market action. Specifically, Trump’s trade rhetoric has continued to keep stocks off-balance. Because tariffs are essentially a tax on consumers, markets are rightfully fearful of the potential negative economic effects of a trade war. While an overnight comment from a Trump official on trade or a tweet from the President himself might cause stocks to sell-off at the market open, it has often happened that stocks shrug off the news and trim losses through the day. Investors, like other observers, may be thinking that the tough trade talk is a negotiating tactic rather than a sea change in the US approach to global trade. If the President is even moderately successful in forcing other countries to lower their tariffs on American goods, then it is difficult to view this negatively on a longer-run basis. While it is true that the US has negotiating leverage in this area because of our huge consumer market, there is no guarantee that the ultimate result will be a freer global trade regime, so we continue to view this as a slight negative.
Since the market correction in early February, stocks have risen in fits and starts as investors continue to digest the news. Although the Dow Jones Industrial Average (DJIA) and S&P 500 still sit below all-time high levels reached early this year, other indices like the NASDAQ Composite, Russell 2000 (small cap stocks), and Russell Midcap Index have made new highs in the past few weeks. Moreover, the market action during the July 4 holiday week must be viewed positively, as the NYSE Advance/Decline line made a new-all time high and the DJIA and S&P 500 rose back above their 200-day and 50-day moving averages, respectively. Defensive sectors/ yield proxies such as real estate, utilities, and consumer staples have also improved, a surprising development in this higher interest rate environment.
On the other hand, one need not look hard to find some nits to pick. Since January 26 when the S&P 500 last made new all-time highs, there has been a distinct bifurcation between financial stocks and the rest of the market. While stocks in general have demonstrated some weakness since then, financials in particular have declined more than twice as much as the market, down some 12% prior to today’s (July 9) strong session for stocks. Most folks point to the flattening yield curve as the culprit for the weakness in the financial sector. Indeed, the spread between the two- and 10-year Treasury notes – the most widely cited shorthand for the slope of the entire yield curve – has narrowed to 28 basis points, the smallest since 2007, and down from 51 basis points at the beginning of the year.
The message here is that investors are demanding a smaller premium for committing capital for a longer period and suggests that they do not expect rates to rise as much in the future. Historically, flattening yield curve implies lower economic growth ahead, and the comparison to the curve back in 2007 is key, as August 2007 was arguably the start of the financial crisis. Could the weakness in financial stocks be signaling more than typical warning of slowing economic growth?
Professional investor Louise Yamada suggests this in her most recent monthly newsletter: “The underperformance of financial may be less related to interest rates and more related to global debt. The Bank for International Settlements in its 2018 annual report says that late-cycle world debt has spiraled to record levels: from 179% of global GDP in 2008 to 217% today.” Debtors—notably emerging market economies that have piled on dollar-denominated borrowings—are vulnerable to higher U.S. rates, she says. And repatriation of U.S. corporate profits held abroad has boosted the dollar and tightened global liquidity. As a result, government and private debtors who owe dollars are getting squeezed and are forced to sell stocks to raise cash, “creating an exodus from riskier equity markets,” Yamada adds. This provides some insight into the recent weakness in emerging markets stocks.
“The financials’ underperformance may be reflecting these stresses differently from 2008 but nevertheless giving us a technical warning,” she writes. Bifurcations among other groups, even technology, are also a poor portent. “Is the G dropping off of FANG?” she asks, reflecting the negative divergence of Google parent Alphabet (GOOGL). “The technical deterioration in the leading areas is often the last holdout prior to a larger market setback.”
The economic data continues to be relatively strong, confirming the late business cycle narrative of above-average growth and inflation. The Federal Reserve Bank of Atlanta’s GDPNow forecast pegs the estimate for 2Q2018 growth at 3.8%, down from 4.1% at the beginning of July. The economy created a healthy 213,000 jobs in June, while the numbers from the previous 2 months were revised upwards. While the unemployment rate ticked up from 3.8% to 4.0% in June, this was actually a bit of good news since it was driven by the entrance of ~600,000 people into the labor force who previously were not seeking work. However, wage growth did slow compared to levels seen a few months ago.
Typically, in mid-term election years the summer stock market action is trendless, but things tend to get more exciting as we move into the fall months. While US stocks seem to be trending positively with the S&P 500 sitting just 3.2% below its all-time high of 2872.87, it would be remiss of us to not remind investors that stocks are not necessarily an attractive investment right now a few months past the bull market’s 9th anniversary. Despite the correction earlier this year and positive trends in corporate earnings, US stocks still sit at some of the richest valuations in market history. At risk of sounding like a broken record, stocks have not been this highly valued outside of a couple of other narrow windows of history – in 1929 right before the Great Crash and then in 1999-2000 before the technology-led bear market of 2000-2002. While we have stressed in prior missives that stock valuations do not make a good market-timing indicator, they do come into play when there is a change in overall market psychology. While the bulls currently still hold the upper hand, the thesis for a continued advance in stocks looks a bit weaker on balance now than it did at the beginning of the year.
If you have a general administrative question about your account, please contact our customer service at 800-535- 4253 option 1. If you need investment advice, please contact your firm’s designated consultant or me. You can reach me at extension 1178 (510-740-4178) or at john.w@wespac.net. John Williams, Manager of Advisory Services – WESPAC