
Market Review & Outlook: January 2018
Submitted by Wespac Advisors, LLC on October 16th, 2018In many ways, 2017 was a tumultuous year, but not when it came to the financial markets. One of the longest bull markets in history shows few signs of slowing down. Depending on how one measures such things, it is now the longest cyclical bull market on record. Expectations were not very high at the beginning of last year. If you go back and average together the forecasts of the various Wall Street strategists, they predicted a modest 5.5% gain for stocks.
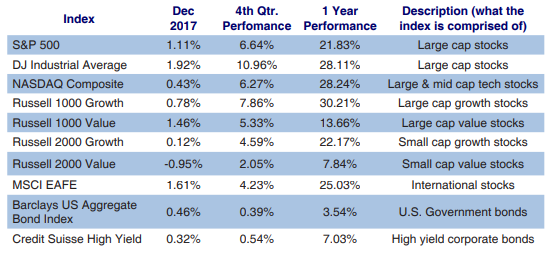
When the year came to a close, both the Dow Jones Industrial Average and the NASDAQ Composite had gained more than 28%, while the S&P 500 gained nearly 22%. Not only did stocks perform exceptionally well, they did so with surprisingly little volatility. The VIX, which is the most widely followed indicator of market volatility, registered nine of its 10 lowest levels ever during 2017. As Mohamed El-Erian noted, “The series of record highs during the year – 71 for the Dow alone – was accompanied by very few episodes of market retracement. And the rare times these occurred, they were comfortably limited in size, duration, and scope.” Overall, the Dow Jones Industrials rose nine months in a row, the longest such streak since 1959, and it was the first year ever that the S&P 500 posted gains in every month. The strong performance in stocks was not limited to the US, as the most widely followed foreign stock benchmarks experienced gains of 25% or more. As one Wall Street veteran says, in a bull market, most of the surprises come on the upside. For a closer look at how various stock and bond asset classes performed in recent periods, please refer to the table.
Conditions were also relatively calm in the fixed income markets, but with much more modest gains (bonds typically underperform stocks). Last January – unlike previous years – more strategists seemed to be coming around to the idea that rates will be lower for longer than they had previously thought. In other words, they were not predicting a rapid rise in rates that would lead to market volatility and likely steep losses in bonds. This was a good call, as the yield on the 10-Year US Treasury note ended the year at 2.41%, or just 4 basis points lower than at the start of the year. Moreover, the US government bond market traded in a relatively narrow range all year, with the 10-Year spending around 80% of the time trading in a band of just 30 basis points. Still, analysts in the space believe that upside in bonds is limited and that risk in the market is probably higher than most recognize. While folks have been calling the stock market expensive for years now, there are underlying, fundamental reasons for the strong performance of last year. First, there is near uniform positive growth in the world’s developed economies right now, and that growth seems to be accelerating. While economic conditions are more mixed in the developing countries, reports from all regions the world over have exceeded economists’ expectations and the overarching trend is positive. Forward looking indicators point to an even faster expansion in the near future, with new orders, export orders, and the future output sentiment index all rising to recent highs. Most strategists and economists also believe that the recent tax bill that passed in Congress will stimulate growth in the US. Whether or not that stimulus has effects that persist beyond the coming year is more a point of contention. Finally, corporate earnings have continued to be strong, as strengthening global economies and a weaker dollar helped fuel gains for large multinationals.
Jeff Saut, longtime market strategist for Raymond James Financial, believes that we are in the midst of a secular bull market that has “years to run.” As a refresher, a secular bull market is a long-term primary trend that lasts 5 to 25 years. This secular trend may be interrupted by corrections that technically meet the definition of bear market (decline of 20% or more), but the primary trend is up. Perhaps the best example of this is the greatest bull market in history that lasted from 1982 to 2000. According to Mr. Saut, secular bull markets have three legs: 1.) the first leg begins at a time marked by widespread pessimism from the previous bear market and driven by accommodative monetary policy. 2.) The second leg is always the longest and strongest and continues to benefit from the easy monetary policy that spurred the first leg. This is when the economy strengthens and corporate earnings tend to be stronger than expected. 3.) The third and final leg is the speculative leg before the end of the market cycle. Mr. Saut believes the second leg of the current bull market started in February of 2016. Obviously, when the second leg ends is unknowable, but he believes we have another 6 or 7 years to go. Certainly Jeff’s is one of the more rosy outlooks among the financial community, but we have been following him for 15+ years and he is rarely far off the mark in his commentary.
Nonetheless, Jeff is a minority in his extreme optimism. A number of other commentators have been cautious, some for years. Of course, some of this caution comes from the lingering hangover that even professional investors have from the trauma of the financial crisis of 2008-2009. At the same time, observed valuations in stocks continue to rank among the richest in market history. The 10 year normalized P/E ratio (also known as the Shiller P/E ratio) rose above 30 for just the third time ever in 2017 and currently stands at 33 (nearly twice the historical mean level). The first time this ever happened was in 1929 and the market and economy crashed a short time later. The second time it happened was in 1997 and the market climbed an additional 80% until the cycle ended in 2000. So one has a hard time making sense of what this means based on the limited sample size.
Even extreme bears such as John Hussman acknowledge that widespread optimism about the market can continue to propel stocks higher in the near term, despite the “hypervalued market.” According to him, “the ‘hinge’ that distinguishes an overvalued market that continues to advance from an overvalued market that drops like a rock is purely psychological – it’s the preference of investors toward speculation or risk-aversion, typically encouraged by shortterm, cyclical factors that lead investors to feel optimistic or fearful.” In other words, if certain conditions change or some negative exogenous event takes place, then market psychology could change quickly. It seems reasonable to expect that global equities will experience more volatility over the coming year than we saw last year, with multiple corrections exceeding 5%. This would certainly be a more normal environment than the calm that characterized 2017.
While international stocks enjoyed good performance last year, they have vastly underperformed US stocks since the financial crisis and therefore are not as richly valued as US stocks. For more aggressive investors, we would recommend overweighting foreign developed and emerging markets stocks and underweighting domestic stocks. It is likely that there is more opportunity in foreign stocks given the valuation disparity. Because we are approaching the ninth anniversary of this bull market in March, we encourage all investors to assess their portfolios and determine if the risk/return profiles align with their own personal facts and circumstances.
If you have a general question about your account, please contact our customer service at 800-535-4253 extension 152. If you need investment advice, please contact me or your firm’s designated consultant. You can reach me at extension 1178 (510-740-4178) or at john.w@wespac.net. John Williams, Manager of Advisory Services – WESPAC