The Interest Rate Conundrum
Submitted by Wespac Advisors, LLC on February 2nd, 2016- 10-Year Treasury rates started a downtrend in 2000, accelerating in the 2008 Crisis; this downtrend was challenged in November-December 2015 as the Federal Reserve ended the ZIRP program, raising the Federal Funds Rate to a target of 0.25-0.50%.
- Contrary to several years’ expectations, this downtrend has not resolved to the upside and long duration rates have dropped significantly since the Fed action; 10-year rates have dropped from around 2.35% in December to 1.88% as of this writing.
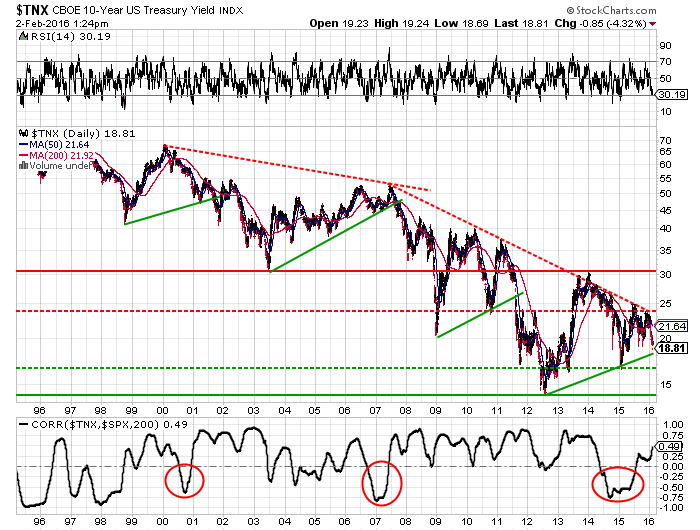
- As I have noted in prior posts, 10-year Treasury rates have a history of breaking price wedges to the downside over the past 15 years; the last three wedge formation breakdowns occurred in 2001, 2007 and 2011.
- With the recent fall in long duration rates, the 10-year is, once again, testing the lower bound of the most current wedge formation; history would suggest that a breakdown of this wedge formation could push 10-year rates at least down to test the January 2015 lows in the 1.65% range and possibly even to the 2012 lows in the 1.4% range.
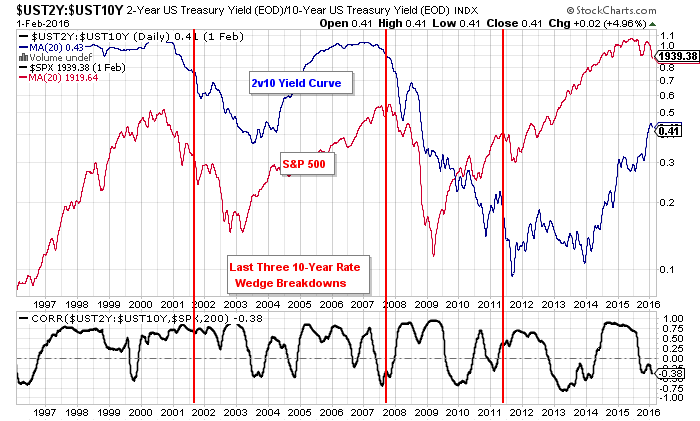
- In all three years 2001, 2007 and 2011, the wedge break in 10-year rates initiated a significant flattening cycle in the 2-year versus 10-year yield curve; these events also surrounded significant duress in the equity markets.
- Read more to see the chart of the 10-year Treasury Rates and 2v10 yield curve.
This is a long-term chart of the 10-year Treasury rates. Note the three wedge formations in 2001, 2007, and 2001 that all resolved to the downside. We are now trading very close to the bottom of the current wedge formation. The possible price targets of a current wedge breakdown would be the January 2015 and June 2012 lows in the 1.4%-1.6% range. We are currently trading in the 1.8% range.
This is a long-term chart comparing the 2-year versus 10-year Treasury Rate yield curve to the S&P 500. The last three wedge breakdowns in 10-year rates occurred around the start of a flattening of the 2v10 yield curve. There were clearly challenges in the equity markets around these events in 2001, 2007 and 2011.