GDP, Peak Debt, and Fed Tightening
Submitted by Wespac Advisors, LLC on December 23rd, 2015It is important to understand the overall environment that has evolved since the 2008 Crisis in terms of economic growth, debt growth, and interest rates; it is this overall view that is the most important context to the Fed’s new tightening program, and the perspective that nobody wants to talk about.
- Economists and the Federal Reserve continue to be surprised that low interest rates, quantitative easing, and fiscal stimulus have not had more effect on GDP:
- The Federal Reserve has found it impossible to get a handle on where the economy is headed — the “central tendency” of the Fed’s real GDP projections over the past five years have missed the mark:
- 2011: Fed projection 3.0-3.6%. Actual 1.6%
- 2012: Fed projection 2.5-2.9%. Actual 2.2%
- 2013: Fed projection 2.3-3.0%. Actual 1.5%
- 2014: Fed projection 2.8-3.2%. Actual 2.4%
- 2015: Fed projection 2.6-3.0%. Actual, YTD through 3Q15 2.2%
- The Federal Reserve Bank of Atlanta’s GDPnow for 4Q15 has dropped from 2.5% at the beginning of November to just 1.3% in their most recent update; 2015 will turn out to be the fifth year in a row of a major miss in their projections.
- The central tendency for the Federal Reserve’s 2016 real GDP growth projections is 2.4-2.7%; the Fed does not see an economic contraction in 2016-2017.
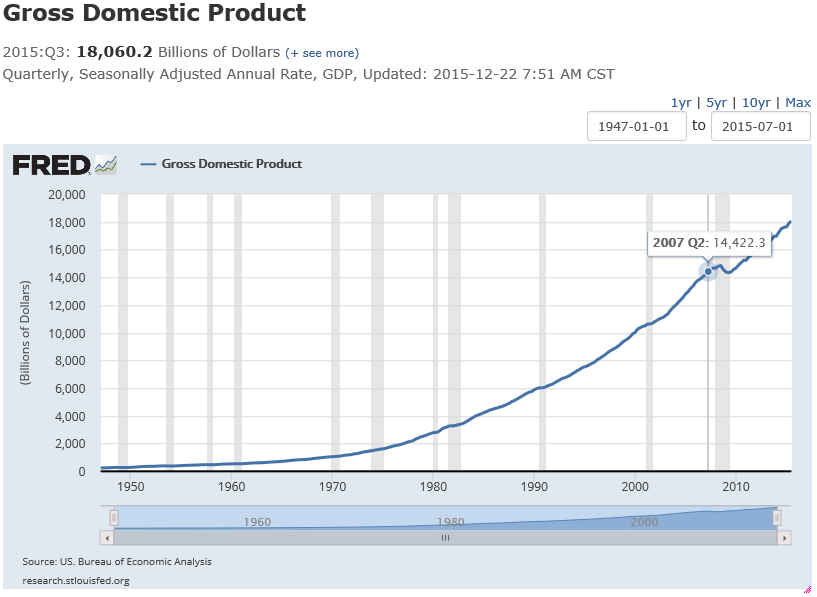
- U.S. GDP has increased from $14.4 trillion in 2Q07 to $18 trillion in 3Q15; this $3.6 trillion increase represents only a 25% increase in 8 years.
- The Federal Reserve has found it impossible to get a handle on where the economy is headed — the “central tendency” of the Fed’s real GDP projections over the past five years have missed the mark:
- The Federal Reserve’s ZIRP program has encouraged growth in debt levels because of cheap debt service:
- U.S. government, the Federal Reserve, U.S. households, and US corporations have accumulated $16.1 trillion in incremental debt from 2Q07 through 3Q15:
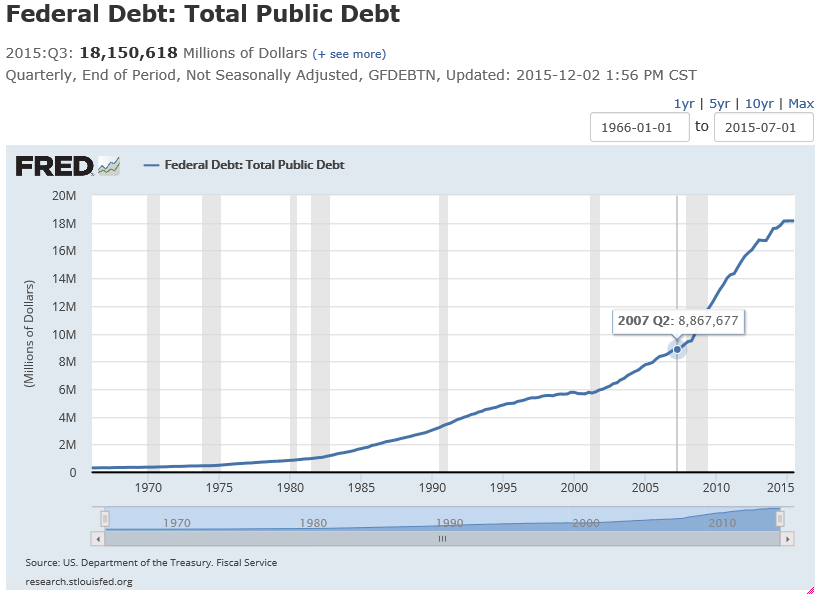
- U.S. government gross public debt has increased from $8.867 trillion to $18.6 trillion, increasing the debt/GDP ratio from 61.4% to 100%.
- The Federal Reserve has increased its balance sheet from $898.3 billion to $4.53 trillion.
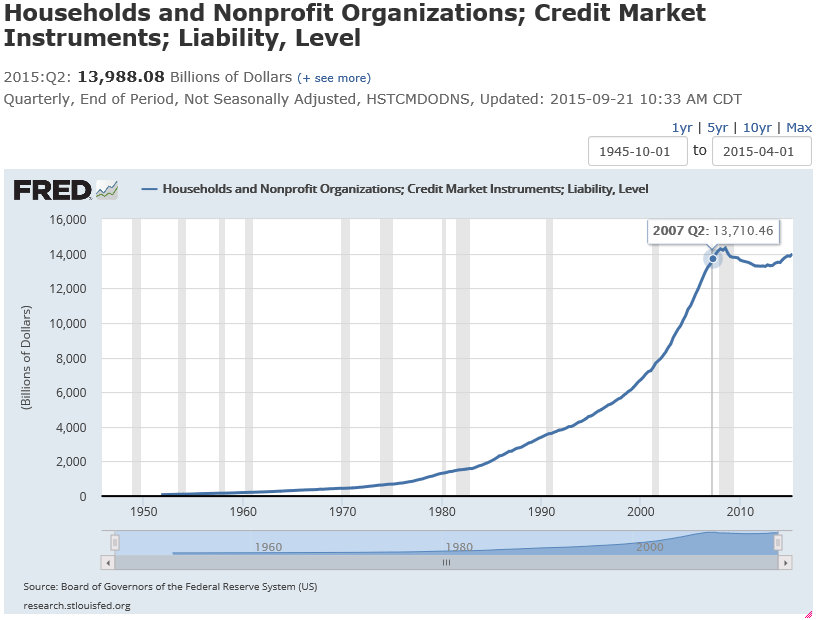
- Households have increased their total debt from $13.7 trillion to $13.98 trillion.
- Corporations have increased their total debt from $5.2 trillion to $8.2 trillion.
- There are two important notes about household and corporate debt:
- Household debt was only up nominally 2Q07 to 3Q15, but is up 274% since 1995 when it was in the $5 trillion range.
- Corporate debt was up about 60% from 2Q07 to 3Q15, but is also up 390% since 1995 when it was in the $2 trillion range.
- While debt has been rapidly increasing, debt service has not because of the Fed’s ZIRP program:
- Net Interest on the Federal debt has declined from $237 billion in 2007 to $229 billion in 2015;
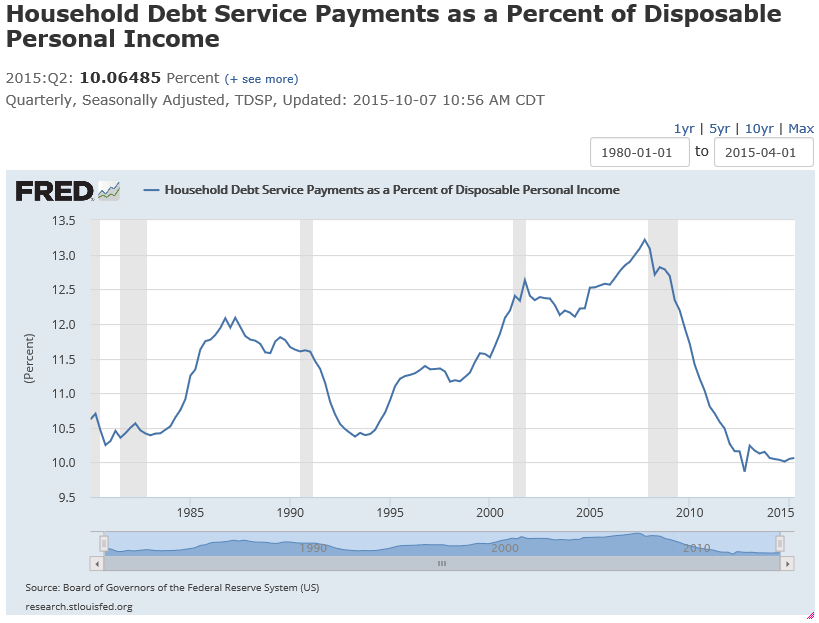
- Household debt service as a percent of disposable income has dropped from around 13% in 2007 to around 10% – about the same level that it was back in 1995 before the geometric increase in household debt.
- U.S. government, the Federal Reserve, U.S. households, and US corporations have accumulated $16.1 trillion in incremental debt from 2Q07 through 3Q15:
- As a nation, we have now invested over $16 trillion in new incremental debt since 2007, GDP has only increased by $3.6 trillion in the same period.
- Forecasters either cannot or are not willing to project the knock-on effects of higher rates and a tightening cycle:
- The President’s 2016 budget is optimistic:
- No recession is forecast through 2020, essentially predicting a 12-year uninterrupted economic expansion.
- Gross debt is expected to rise from $18.6 trillion in 2015 to $22.4 trillion in 2020; a 20% increase in 5 years.
- Net Interest is expected to rise from $229 billion in 2015 to $560 billion in 2020 and $857 billion in 2025; a 244% increase in 5 years.
- Total Receipts are expected to rise from $3.176 trillion to $4.33 trillion from 2015-2020; a 36% increase in 5 years (over the 8 years from 2007-2015, total receipts only increased 23%)
- While it is difficult to see the actual calculations, it appears that the effective interest rate that the US must pay to finance its debt will increase from around 1% in 2015 to around 2.5% in 2020 and 3.2% in 2025.
- The forecast for higher total receipts, growing at a rate that seems highly unlikely, results in relatively nominal deficit levels over the forecast period.
- The President’s 2016 budget is optimistic:
It does not take an economist or an accountant to understand that a recession at this juncture is going to be a significant event as debt service, which has no economic benefit and crowds out productive investment, begins to rise.